Redis的官方网站是https://redis.io/,也有中文的网站 http://www.redis.cn/。
Redis 当前的稳定版本是3.2(具体是3.2.9),最新版本是4.0。
在本文你将看到:
1. Redis的基础知识,如redis的数据类型,redis的安装配置,redis的主要参数设置等等。
2. Redis的主从复制,以及Redis的自动主从切换的高可用架构(Sentinel)
3. Redis的集群高可用架构,即Redis Cluster(包含主从自动切换和数据分片)
4. Redis的监控
5. Redis的docker化。
6. Redis 4.0的新特性
一、Redis基础知识
1. redis是一个内存数据库,是key value的方式记录数据。redis是单进程单线程,所以只占用一个cpu,所以在监控时候,多CPU主机的平均使用cpu可能使用率低,但是可能redis进程使用的那个cpu已经打满。
redis的主要操作命令工具是redis-cli,提供交互命令行,类似sqlplus,进行数据的操作。
redis数据类型主要有如下5种:(其他还有bitmap,hyperloglog等等,这里不做讨论)
1.1 string类型:
• set 插入或者修改(注1:不能存相同的字符串;注2:无序,无左右)
• get 获取
• del 删除
127.0.0.1:6379> set name oracleblog
OK
127.0.0.1:6379> get name
"oracleblog"
127.0.0.1:6379> set name oracleblog
OK
127.0.0.1:6379> get name
"oracleblog"
127.0.0.1:6379>
#可以看到即使set了两次,但是其实只有一个值
应用场景:一般的key-value。注,一个value最大可以容纳512Mb长度的string值。
1.2 list类型
• lpush/rpush 将值插入左端/右端 (注:list可以存储多个相同的串)
• lrange 获取给定范围的列表中的值
• lindex 获取列表中的某个值
• lpop 从左边弹出列表中的一个值(注:pop之后,值就不在列表中了)
127.0.0.1:6379> lpush lname oracle
(integer) 1
127.0.0.1:6379> lpush lname mysql
(integer) 2
127.0.0.1:6379> lpush lname oracle
(integer) 3
127.0.0.1:6379> lpush lname mssql
(integer) 4
127.0.0.1:6379> lrange lname 0 100
1) "mssql"
2) "oracle"
3) "mysql"
4) "oracle"
127.0.0.1:6379>
127.0.0.1:6379> lindex lname 2
"mysql"
127.0.0.1:6379>
注,最多可以包含2^32个元素。
1.3 set类型
• sadd 插入(set通过hash列表保证自己存储的每个字符串是不同的,无序,无左右)
• smember 列出所有member
• sismember 判断是否为member
• srem移除
127.0.0.1:6379> sadd sname s-mysql
(integer) 1
127.0.0.1:6379> sadd sname s-oracle
(integer) 1
127.0.0.1:6379> sadd sname s-mssql
(integer) 1
127.0.0.1:6379> sadd sname s-oracle
(integer) 0
127.0.0.1:6379> sadd sname s-mssql
(integer) 0
127.0.0.1:6379> sadd sname s-redis
(integer) 1
127.0.0.1:6379>
127.0.0.1:6379> sadd sname s-mango s-postgres
(integer) 2
127.0.0.1:6379>
127.0.0.1:6379> smembers sname
1) "s-redis"
2) "s-mssql"
3) "s-oracle"
4) "s-mango"
5) "s-postgres"
6) "s-mysql"
127.0.0.1:6379>
使用场景:你我的共同朋友,共同爱好等等
1.4 hash类型
• hset 插入
• hget 获取指定hash列
• hgetall 获取所有hash列的所有键值
• hdel 如果给定键存在于hash列里面,则删除这个键。
127.0.0.1:6379> hset hname passwd1 dji123
(integer) 1
127.0.0.1:6379> hset hname passwd1 dji123
(integer) 0
127.0.0.1:6379> hset hname passwd1 dji124
(integer) 0
127.0.0.1:6379> hgetall hname
1) "passwd1"
2) "dji124"
127.0.0.1:6379>
#注,后一个替换掉了前一个。
127.0.0.1:6379> hset hname passwd2 dji222 passwd3 dji333 passwd4 dji444
(error) ERR wrong number of arguments for 'hset' command
127.0.0.1:6379>
127.0.0.1:6379> hmset hname passwd2 dji222 passwd3 dji333 passwd4 dji444
OK
127.0.0.1:6379> hgetall hname
1) "passwd1"
2) "dji124"
3) "passwd2"
4) "dji222"
5) "passwd3"
6) "dji333"
7) "passwd4"
8) "dji444"
127.0.0.1:6379>
#注,如果要一次set多个hash,需要hmset
1.5 zset类型(有序集合)
• zadd
• zrange
• zrangebyscore
• zrem
127.0.0.1:6379> zadd zname 1 oracle
(integer) 1
127.0.0.1:6379> zadd zname 2 mysql
(integer) 1
127.0.0.1:6379> zadd zname 3 mssql
(integer) 1
127.0.0.1:6379> zadd zname 3 redis
(integer) 1
127.0.0.1:6379> zrangebyscore zname 0 1000
1) "oracle"
2) "mysql"
3) "mssql"
4) "redis"
127.0.0.1:6379>
127.0.0.1:6379>
127.0.0.1:6379>
127.0.0.1:6379> zrange zname 0 1000
1) "oracle"
2) "mysql"
3) "mssql"
4) "redis"
127.0.0.1:6379>
使用场景:排行榜,投票等等
2.持久化
2.1 RDB,类似snapshot。
当符合一定条件时 redis 会folk一个进程,利用copy on write原理,自动将内存中的所有数据生成一份副本并保存到硬盘上。
过程:
遍历每个DB,遍历每个db的dict,获取每个dictEntry
获取key后查询expire,如过期就丢弃
将数据的key,value,expiretime等写入文件
计算checksum,通过checksum交换旧的rdb文件。
执行的前提条件:
1)配置自动快照的规则
2)用户执行了 SAVE 或 BGSAVE 命令
3)执行 FLUSHALL 命令
4)执行复制时
缺点:一旦 redis 程序退出,会丢失最后一次快照以后更改的所有数据。
相关参数有:
save 60 100
stop-write-on-bysave-error no
rdbcompression yes
dbfilename dump.rdb
注,bgsave
如果redis在虚拟机上,那么bgsave时间可能会加长。
redis进程每占用1G内存,bgsave创建子进程所需要的时间增加10~20ms
save和bgsave的区别:save一直阻塞到快照生成。而bgsave由子进程完成。
RDB文件解析:
以db0中只存在set msg “hello”为例:

2.2 AOF,类似归档,起到追加的作用。
注,每次数操作都会调用flushApendOnlyFile来刷新AOF,每次操作都需要fsync,前台线程阻塞。
注,选用ssd将明显提高aof的性能。
相关参数有:
appendonly yes
appendsync everysec
no-appendsync-on-rewrite no
auto-aof-rewrite-percent 100
auto-aof-rewrite-min-size 64mb
dir ~/
AOF文件解析:
[root@redis01 6399]# cat  appendonly.aof
*2         #2个参数
$6         #第一个参数长度是6
SELECT     #第一个参数值是SELECT
$1         #第二个参数长度是
0          #第二个参数的值是0
*3         #3个参数
$3         #第一个参数长度是3
SET        #第一个参数值是SET
$4         #第二个参数长度是4
col2       #第二个参数值是col2
$2         #第三个参数长度是2
v2         #第三个参数值是v2
也就是如下:
select 0 ##选择db0
set col2 v2 ##插入key-value,col2-v2。
AOF重写(BGREWRITEAOF):
目的:减少AOF文件大小
触发条件:
1. 发起命令bgrewriteaof
2. aof文件的大小增长超过一定比例,且aof文件实际大小超过一定
# Specify a percentage of zero in order to disable the automatic AOF
# rewrite feature.

auto-aof-rewrite-percentage 100
auto-aof-rewrite-min-size 64mb
注,目前key的条目不多于64,如果多于64个条目,会进行拆分。
/* Static server configuration */
……
#define LOG_MAX_LEN    1024 /* Default maximum length of syslog messages */
#define AOF_REWRITE_PERC  100
#define AOF_REWRITE_MIN_SIZE (64*1024*1024)
#define AOF_REWRITE_ITEMS_PER_CMD 64
#define CONFIG_DEFAULT_SLOWLOG_LOG_SLOWER_THAN 10000
#define CONFIG_DEFAULT_SLOWLOG_MAX_LEN 128
……
2.3 数据完整性
如果允许几分钟的数据丢失。可以采用rdb,如果需要持续记录,那么可以采用aof。另外,从性能考虑,由于aof是持续写,可以将aof放在备库,主库只有rdb。
注,redis server异常crash后重启,将进行如下优先级操作:
如果只配置了aof,启动时加载aof
如果同步配置了aof和rdb,启动时只加载aof
如果只配置了rdb,启动时加载rdb的dump文件。
注,在linux 6(centos 6,redhat 6,oel 6)中,重启redis可以用/etc/init.d/redis-server restart命令,但是这个命令在重启的时候是不save的。就会导致如果不开aof,会丢失上次save之后的数据。
正确的做法是redis-cli之后,用shutdown命令(默认带save),或者shutdown save命令。不要用shutdown nosave。
如果在中途开启AOF,比较好的方式是:
a. 动态的修改CONFIG SET appendonly yes,此时会生成appendonly.aof 文件,不仅包含修改之前的值,还包含修改之后的值。
b. 修改redis.conf的值为appendonly yes
c. 在有停机窗口的时候,重启redis。
掉电导致AOF或者rdb文件损坏,相关修复工具:
redis-check-aof 检查、修复aof(会删除出错命令之后(含)所有的命令)
redis-check-dump 检查、修复rdb
3. Redis的key过期(expire)。
我们可以设置某个key过期:
127.0.0.1:6379> get testexpire
(nil)
127.0.0.1:6379> set testexpire value1
OK
127.0.0.1:6379> get testexpire
"value1"
127.0.0.1:6379>
127.0.0.1:6379>
127.0.0.1:6379> expire testexpire 60
(integer) 1
127.0.0.1:6379>
127.0.0.1:6379> ttl testexpire
(integer) 56
127.0.0.1:6379>
127.0.0.1:6379> set testexpire value2
OK
127.0.0.1:6379> get testexpire
"value2"
127.0.0.1:6379>
127.0.0.1:6379> ttl testexpire
(integer) -1
127.0.0.1:6379> ttl testexpire
(integer) -1
127.0.0.1:6379> get testexpire
"value2"
127.0.0.1:6379> ttl testexpire
(integer) -1
127.0.0.1:6379> ttl testexpire
(integer) -1
127.0.0.1:6379>
127.0.0.1:6379>
127.0.0.1:6379> expire testexpire 10
(integer) 1
127.0.0.1:6379> ttl testexpire
(integer) 8
127.0.0.1:6379> ttl testexpire
(integer) 5
127.0.0.1:6379> ttl testexpire
(integer) 1
127.0.0.1:6379> ttl testexpire
(integer) -2
127.0.0.1:6379> get testexpire
(nil)
127.0.0.1:6379>
上面的测试中,ttl key,返回-1表示不会expire,-2表示已经expired。大于0的数字表示剩余时间。另外可以看到,当set新值之后覆盖了原来的值,则设置在原来key上的expire也被取消了。
注1. Redis keys过期后叫volatile(在后面谈到设置maxmemory-policy的时候,会提到这个词),过期删除有两种方式:被动和主动方式。
当一些客户端尝试访问它时,key会被发现并主动的过期。

当然,这样是不够的,因为有些过期的keys,永远不会访问他们。
所以Redis每秒10次做的事情:
测试随机的20个keys进行相关过期检测。
删除所有已经过期的keys。
如果有多于25%的keys过期,重复步骤1.
注2.expire的限制:只能应用于整个键,而不能对键的某一部分数据做expire。也就是说,expire 列,不能expire 行。
注3. RDB对过期key的处理:过期key对RDB没有任何影响
从内存数据库持久化数据到RDB文件
持久化key之前,会检查是否过期,过期的key不进入RDB文件
从RDB文件恢复数据到内存数据库
数据载入数据库之前,会对key先进行过期检查,如果过期,不导入数据库(主库情况)
注4. AOF对过期key的处理:过期key对AOF没有任何影响
从内存数据库持久化数据到AOF文件:
当key过期后,还没有被删除,此时进行执行持久化操作(该key是不会进入aof文件的,因为没有发生修改命令)
当key过期后,在发生删除操作时,程序会向aof文件追加一条del命令(在将来的以aof文件恢复数据的时候该过期的键就会被删掉)
AOF重写
重写时,会先判断key是否过期,已过期的key不会重写到aof文件
不过期的话,到达maxmemory之后,所有和内存增加的操作都会报错。在64bit系统下,maxmemory默认设置为0表示不限制Redis内存使用,在32bit系统下,maxmemory隐式不能超过3GB。 所以在64位系统中,默认值是个危险的值。
当memory使用量到达maxmemory之后,将根据设置的maxmemory-policy的方式,进行内存回收。
maxmemory-policy可以设置的值有:
1. noeviction:返回错误当内存限制达到并且客户端尝试执行会让更多内存被使用的命令(大部分的写入指令,但DEL和几个例外)
2. allkeys-lru: 尝试回收最少使用的键(LRU),使得新添加的数据有空间存放。
3. volatile-lru: 尝试回收最少使用的键(LRU),但仅限于在过期集合的键,使得新添加的数据有空间存放。
4. allkeys-random: 回收随机的键使得新添加的数据有空间存放。
5. volatile-random: 回收随机的键使得新添加的数据有空间存放,但仅限于在过期集合的键。
6. volatile-ttl: 回收在过期集合的键,并且优先回收存活时间(TTL)较短的键,使得新添加的数据有空间存放。
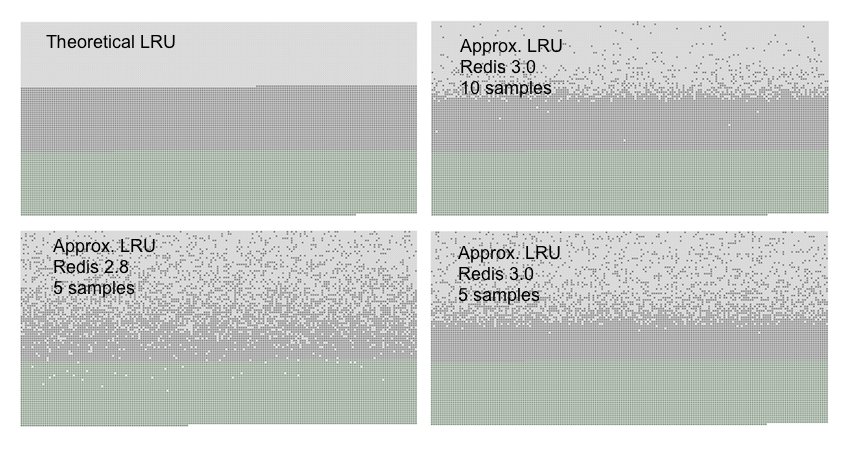
注,redis采用的LRU算法是近似LRU算法,LRU的采样率通过设置如maxmemory-samples 5来确定。新版本的redis的近似LRU算法,在同等的maxmemory-samples条件下,比旧版本的好很多。
4 redis的安装。
4.1 主机相关参数配置(注, for Linux 7):
4.1.1. 选择文件系统至少为ext4,xfs更佳。
4.1.2. 关闭numa,关闭redis所在文件系统/分区的atime选项。
4.1.3. 如果是非SSD,设置文件系统IO调度方式为deadline,如果是SSD则为noop。
4.1.4. 调整kernel。
4.1.4.1 检查当前操作系统使用的tuned profile
cat /etc/tuned/active_profile
virtual-guest
4.1.4.2. 建立一个目录用来放for redis的tuned profile
mkdir /etc/tuned/for_redis
4.1.4.3. 将当前系统默认的tune profile复制到for redis 下:
cp /usr/lib/tuned/virtual-guest/tuned.conf /etc/tuned/for_redis/
4.1.4.4.修改/etc/tuned/for_redis/
[main]
include=throughput-performance
[vm]
transparent_hugepages=never
[sysctl]
vm.dirty_ratio = 30
vm.swappiness = 30
vm.overcommit_memory = 1
net.core.somaxconn = 65535
4.1.4.5.指定tuned profile为for_redis
tuned-adm profile for_redis
4.1.4.6.重启主机。
4.2 下载、解压redis:
mkdir /root/redis_install
cd /root/redis_install
wget http://download.redis.io/releases/redis-3.2.9.tar.gz
tar -zxvf /root/redis_install/redis-3.2.9.tar.gz
cd /root/redis_install/redis-3.2.9
make
make test
注,make test时如果报错You need tcl 8.5 or newer in order to run the Redis test,则需要yum install tcl,正常情况下,如果make test通过,则显示如下: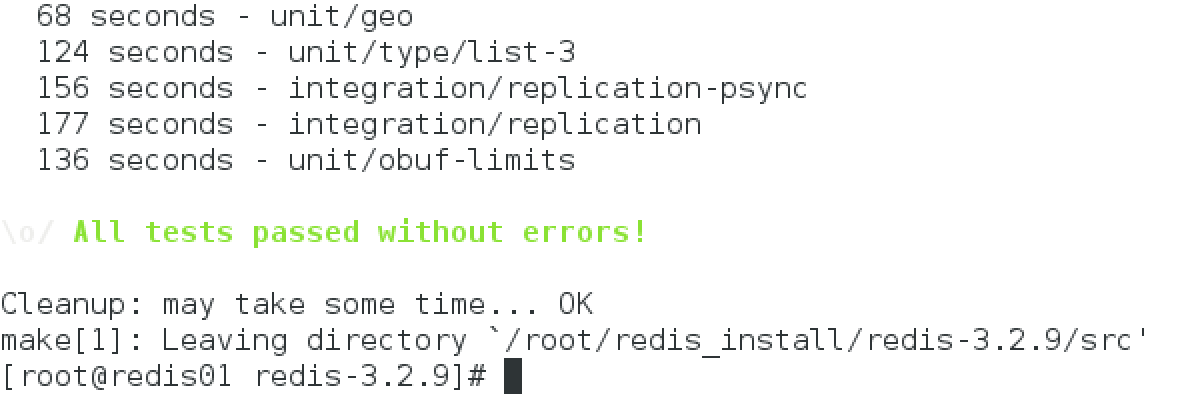
make install
mkdir -p /etc/redis
mkdir -p /var/redis
mkdir -p /var/redis/6379
cp /root/redis_install/redis-3.2.9/redis.conf /etc/redis/redis_6379.conf
修改redis_6379.conf
daemonize yes
pidfile /var/run/redis_6379.pid
logfile /var/log/redis_6379.log
dir /var/redis/6379
## 注释掉IP绑定,使得其他主机的客户端也可以连接redis
# bind 127.0.0.1
## 设置远程访问密码。本案例允许远程访问,已经取消设置bind为127.0.0.1和protected-mode yes
requirepass "oracleblog"
## 修改高危命令为error命令。
rename-command FLUSHDB "FLUSHDB_ORACLE_MASK"
rename-command FLUSHALL "FLUSHALL_ORACLE_MASK"
rename-command CONFIG "CONFIG_ORACLE_MASK"
##如果不是如下save值,请修改配置
save 900 1
save 300 10
save 60 10000
appendonly yes
##注,tcp-backlog需要小于操作系统设置的somaxconn大小
tcp-backlog 511
##最多设置maxmemory为内存40%。(40%用于redis,40%用于bgsave,20%用于系统)
maxmemory 838860800
maxmemory-policy allkeys-lru
maxmemory-samples 5
启动:redis-server /etc/redis/redis_6379.conf
连接:redis-cli -a oracleblog -h 192.168.56.108 -p 6380 (注,oracleblog就是在requiepass中设置的密码)
关闭:192.168.56.108:6379> shutdown save
5. 一个redis最多包含16个db,可以通过select进行跳转,move可以转移key到别的db。
127.0.0.1:6399> keys *
1) "col6"
2) "col2"
3) "col1"
4) "col5"
5) "col3"
6) "col4"
127.0.0.1:6399>
127.0.0.1:6399> select 1
OK
127.0.0.1:6399[1]> keys *
(empty list or set)
127.0.0.1:6399[1]>
127.0.0.1:6399[1]> set db1_col1 v1;
OK
127.0.0.1:6399[1]>
127.0.0.1:6399[1]>
127.0.0.1:6399[1]> keys *
1) "db1_col1"
127.0.0.1:6399[1]>
127.0.0.1:6399[1]>
127.0.0.1:6399[1]> select 0
OK
127.0.0.1:6399> move col2 1
(integer) 1
127.0.0.1:6399>
127.0.0.1:6399> select 1
OK
127.0.0.1:6399[1]> keys *
1) "col2"
2) "db1_col1"
127.0.0.1:6399[1]>
二、redis的主从复制和sentinel
1. 主从复制配置:
我们来配一个1主2从的redis。分别是在3台主机,3个端口上。
主:192.168.56.108 port 6379 –> 从1:192.168.56.109 port 6380 –> 从2:192.168.56.110 port 6381
各个主机上的配置文件:
/etc/redis/redis_6379.conf
不需要改


在运行状态下:
slaveof 192.168.56.108 6379
CONFIG_ORACLE_MASK set masterauth oracleblog
并且修改/etc/redis/redis_6380.conf
slaveof 192.168.56.108 6379
masterauth oracleblog


slaveof 192.168.56.109 6380
CONFIG_ORACLE_MASK set masterauth oracleblog
并且修改/etc/redis/redis_6381.conf
slaveof 192.168.56.109 6380
masterauth oracleblog
注1:复制启动过程中,从节点会丢弃旧数据(如果有的话)
注2:实际使中最好让redis主节点只使用50%~60%内存,留30%~45%用于bgsave。
注3:redis不支持主-主复制
注4:redis支持级联主从
注5:info命令看:aof-pending_bio_fsync是否为0,如果为0,表示主从同步正常。aof-pending_bio_fsync的含义是number of fsync pending job in background I/O queue
注6:从网上的测试看,启动复制,比没有复制的TPS会有所降低,在100 client并发的情况下,大约降低30%。响应时间,从0.8毫秒到1.2毫秒。
如何更换故障的主服务器:
(1)A -----------> B
(2)A(crash)     B
(3)A(crash)     B(运行save命令生成rdb)
(4)A(crash)     B -----(将rdb传输到C主机)-----  C
(5)A(crash)     B-----(slaveof C port)------> C
2. 高可用架构sentinel配置:
sentinel是redis实例的一个特殊模式,可以通过如下两种方式启动:
redis-sentinel /path/to/sentinel.conf
和
redis-server /path/to/sentinel.conf –sentinel
Sentinel 原理:
1. Sentinel 集群通过给定的配置文件发现 master,启动时会监控 master。通过向 master 发送 info 信息获得该服务器下面的所有从服务器。
2. Sentinel 集群通过命令连接向被监视的主从服务器发送 hello 信息 (每秒一次),该信息包括 Sentinel 本身的 IP、端口、id 等内容,以此来向其他 Sentinel 宣告自己的存在。
3. Sentinel 集群通过订阅连接接收其他 Sentinel 发送的 hello 信息,以此来发现监视同一个主服务器的其他 Sentinel;集群之间会互相创建命令连接用于通信,因为已经有主从服务器作为发送和接收 hello 信息的中介,Sentinel 之间不会创建订阅连接。
4. Sentinel 集群使用 ping 命令来检测实例的状态,如果在指定的时间内(down-after-milliseconds)没有回复或则返回错误的回复,那么该实例被判为下线。
5. 当 failover 主备切换被触发后,failover 并不会马上进行,还需要 Sentinel 中的大多数 Sentinel 授权后才可以进行 failover,即进行 failover 的 Sentinel 会去获得指定 quorum 个的 Sentinel 的授权,成功后进入 ODOWN 状态。如在 5 个 Sentinel 中配置了 2 个 quorum,等到 2 个 Sentinel 认为 master 死了就执行 failover。
6. Sentinel 向选为 master 的 slave 发送 SLAVEOF NO ONE 命令,选择 slave 的条件是 Sentinel 首先会根据 slaves 的优先级来进行排序,优先级越小排名越靠前。如果优先级相同,则查看复制的下标,哪个从 master 接收的复制数据多,哪个就靠前。如果优先级和下标都相同,就选择进程 ID 较小的。
7. Sentinel 被授权后,它将会获得宕掉的 master 的一份最新配置版本号 (config-epoch),当 failover 执行结束以后,这个版本号将会被用于最新的配置,通过广播形式通知其它 Sentinel,其它的 Sentinel 则更新对应 master 的配置。
●主观下线(Subjectively Down, 简称 SDOWN)指的是单个 Sentinel 实例对服务器做出的下线判断。
●客观下线(Objectively Down, 简称 ODOWN)指的是多个 Sentinel 实例在对同一个服务器做出 SDOWN 判断, 并且通过 SENTINEL is-master-down-by-addr 命令互相交流之后, 得出的服务器下线判断。
注,客观下线条件只适用于主服务器。
1 到 3 是自动发现机制:
以 10 秒一次的频率,向被监视的 master 发送 info 命令,根据回复获取 master 当前信息。
以 1 秒一次的频率,向所有 redis 服务器、包含 Sentinel 在内发送 PING 命令,通过回复判断服务器是否在线。
以 2 秒一次的频率,通过向所有被监视的 master,slave 服务器发送当前 Sentinel master 信息的消息。
4 是检测机制,5 和 6 是 failover 机制,7 是更新配置机制。
#该行的意思是sentinel工作在62379端口,这个是默认sentinel端口,可以修改。
port 26379
#该行的意思是:监控的master的名字叫做mymaster(自定义),地址为127.0.0.1:6379,行尾最后的一个2代表在sentinel集群中,多少个sentinel认为masters死了,才能真正认为该master不可用了。
sentinel monitor mymaster 192.168.56.108 6379 2
#该行的意思是sentinel会向master发送心跳PING来确认master是否存活,如果master在“一定时间范围”内不回应PONG 或者是回复了一个错误消息,那么这个sentinel会主观地(单方面地)认为这个master已经不可用了(subjectively down, 也简称为SDOWN)。而这个down-after-milliseconds就是用来指定这个“一定时间范围”的,单位是毫秒,默认30秒。
sentinel down-after-milliseconds mymaster 60000
#该行的意思是sentinel会向master发送心跳PING来确认master是否存活,如果master在“一定时间范围”内不回应PONG 或者是回复了一个错误消息,那么这个sentinel会主观地(单方面地)认为这个master已经不可用了(subjectively down, 也简称为SDOWN)。而这个down-after-milliseconds就是用来指定这个“一定时间范围”的,单位是毫秒,默认30秒。
sentinel failover-timeout mymaster 180000
#该行的意思是,在发生failover主备切换时,这个选项指定了最多可以有多少个slave同时对新的master进行同步,这个数字越小,完成failover所需的时间就越长,但是如果这个数字越大,就意味着越多的slave因为replication而不可用。可以通过将这个值设为 1 来保证每次只有一个slave处于不能处理命令请求的状态。
sentinel parallel-syncs mymaster 1
sentinel auth-pass mymaster oracleblog
## Following parameter add by Jimmy
daemonize yes
logfile /var/log/redis_sentinel_6379.log
pidfile /var/run/redis_sentinel_6379.pid
# bind 127.0.0.1 注意,不能加bind,因为sentinel之间会互相通信,需要做仲裁
dbfilename dump_sentinel.rdb
#注意每个sentinel 的myid应该都不一样,否则会互相忽略对方的存在
sentinel myid be167fc5c77a14ef53996d367e237d3cc33a53b6
#注意需要rename-command还原,因为sentinel会使用这些命令,不然会造成虽然可以识别节点故障,但是无法实现切换。
#rename-command FLUSHDB "FLUSHDB_ORACLE_MASK"
#rename-command FLUSHALL "FLUSHALL_ORACLE_MASK"
#rename-command CONFIG "CONFIG_ORACLE_MASK
注:sentinel不建议是单个,因为:
1:即使有一些sentinel进程宕掉了,依然可以进行redis集群的主备切换;
2:如果只有一个sentinel进程,如果这个进程运行出错,或者是网络堵塞,那么将无法实现redis集群的主备切换(单点问题);
3:如果有多个sentinel,redis的客户端可以随意地连接任意一个sentinel来获得关于redis集群中的信息
实施步骤:
我们来配一个1主2从的redis。分别是在3台主机,3个端口上。
主:192.168.56.108 port 6379 --> 从1:192.168.56.109 port 6380
       |
       |
       L--> 从2:192.168.56.110 port 6381
1. cp /root/redis_install/redis-3.2.9/sentinel.conf /etc/redis/sentinel_6379.conf
2. 按照上面说的配置项进行修改
3. redis-sentinel /etc/redis/sentinel_6379.conf
4. 在其他从节点重复上面的步骤
5. 在主节点redis-cli -p 26379 ping,正常返回pong,在从1节点redis -p 26380 ping,正常返回pong;在从2节点redis-cli -p 26381 ping,正常会返回pong
6. 在从1节点redis-cli -p 26380 sentinel masters,显示如下,注意34行和35行,显示了有2个slave和察觉到了有2个sentinel:
127.0.0.1:26379> sentinel masters
1)  1) "name"
    2) "mymaster"
    3) "ip"
    4) "192.168.56.108"
    5) "port"
    6) "6379"
    7) "runid"
    8) "357e8a88b9ae5aeb325f16239aac20ec965ae167"
    9) "flags"
   10) "master"
   11) "link-pending-commands"
   12) "0"
   13) "link-refcount"
   14) "1"
   15) "last-ping-sent"
   16) "0"
   17) "last-ok-ping-reply"
   18) "970"
   19) "last-ping-reply"
   20) "970"
   21) "down-after-milliseconds"
   22) "30000"
   23) "info-refresh"
   24) "9971"
   25) "role-reported"
   26) "master"
   27) "role-reported-time"
   28) "713185"
   29) "config-epoch"
   30) "0"
   31) "num-slaves"
   32) "2"
   33) "num-other-sentinels"
   34) "2"
   35) "quorum"
   36) "2"
   37) "failover-timeout"
   38) "180000"
   39) "parallel-syncs"
   40) "1"
127.0.0.1:26379>
7. 在从1节点运行sentinel slaves mymaster:
[root@redis02 ~]# redis-cli -p 26380 sentinel slaves mymaster
1)  1) "name"
    2) "192.168.56.110:6381"
    3) "ip"
    4) "192.168.56.110"
    5) "port"
    6) "6381"
    7) "runid"
    8) "aaa02dfaf12a59bba2b84c0b2b1bc6fb13ae76e2"
    9) "flags"
   10) "slave"
   11) "link-pending-commands"
   12) "0"
   13) "link-refcount"
   14) "1"
   15) "last-ping-sent"
   16) "0"
   17) "last-ok-ping-reply"
   18) "373"
   19) "last-ping-reply"
   20) "373"
   21) "down-after-milliseconds"
   22) "30000"
   23) "info-refresh"
   24) "8707"
   25) "role-reported"
   26) "slave"
   27) "role-reported-time"
   28) "500482"
   29) "master-link-down-time"
   30) "0"
   31) "master-link-status"
   32) "ok"
   33) "master-host"
   34) "192.168.56.108"
   35) "master-port"
   36) "6379"
   37) "slave-priority"
   38) "100"
   39) "slave-repl-offset"
   40) "274239"
2)  1) "name"
    2) "192.168.56.109:6380"
    3) "ip"
    4) "192.168.56.109"
    5) "port"
    6) "6380"
    7) "runid"
    8) "860e99210956e311ad522e7f5c582e7ba50d09bd"
    9) "flags"
   10) "slave"
   11) "link-pending-commands"
   12) "0"
   13) "link-refcount"
   14) "1"
   15) "last-ping-sent"
   16) "0"
   17) "last-ok-ping-reply"
   18) "373"
   19) "last-ping-reply"
   20) "373"
   21) "down-after-milliseconds"
   22) "30000"
   23) "info-refresh"
   24) "8707"
   25) "role-reported"
   26) "slave"
   27) "role-reported-time"
   28) "500482"
   29) "master-link-down-time"
   30) "0"
   31) "master-link-status"
   32) "ok"
   33) "master-host"
   34) "192.168.56.108"
   35) "master-port"
   36) "6379"
   37) "slave-priority"
   38) "100"
   39) "slave-repl-offset"
   40) "274239"
[root@redis02 ~]#
8.在从1运行sentinel get-master-addr-by-name :
[root@redis02 ~]# redis-cli -p 26380 sentinel get-master-addr-by-name mymaster
1) "192.168.56.108"
2) "6379"
[root@redis02 ~]#
9. kill掉redis进程,或者运行sentinel failover命令:
在节点1的log中,可以看到:
2824:X 27 Jun 05:58:05.551 # +new-epoch 17
2824:X 27 Jun 05:58:05.551 # +config-update-from sentinel be167fc5c77a14ef53996d367e237d3cc33a53b6 192.168.56.109 26380 @ mymaster 192.168.56.108 6379
2824:X 27 Jun 05:58:05.551 # +switch-master mymaster 192.168.56.108 6379 192.168.56.109 6380
2824:X 27 Jun 05:58:05.551 * +slave slave 192.168.56.110:6381 192.168.56.110 6381 @ mymaster 192.168.56.109 6380
2824:X 27 Jun 05:58:05.551 * +slave slave 192.168.56.108:6379 192.168.56.108 6379 @ mymaster 192.168.56.109 6380
2824:X 27 Jun 05:58:15.594 * +convert-to-slave slave 192.168.56.108:6379 192.168.56.108 6379 @ mymaster 192.168.56.109 6380
在节点2的log中可以看到:
3047:X 27 Jun 05:58:05.272 # Executing user requested FAILOVER of 'mymaster'
3047:X 27 Jun 05:58:05.273 # +new-epoch 17
3047:X 27 Jun 05:58:05.273 # +try-failover master mymaster 192.168.56.108 6379
3047:X 27 Jun 05:58:05.285 # +vote-for-leader be167fc5c77a14ef53996d367e237d3cc33a53b6 17
3047:X 27 Jun 05:58:05.285 # +elected-leader master mymaster 192.168.56.108 6379
3047:X 27 Jun 05:58:05.285 # +failover-state-select-slave master mymaster 192.168.56.108 6379
3047:X 27 Jun 05:58:05.362 # +selected-slave slave 192.168.56.109:6380 192.168.56.109 6380 @ mymaster 192.168.56.108 6379
3047:X 27 Jun 05:58:05.362 * +failover-state-send-slaveof-noone slave 192.168.56.109:6380 192.168.56.109 6380 @ mymaster 192.168.56.108 6379
3047:X 27 Jun 05:58:05.424 * +failover-state-wait-promotion slave 192.168.56.109:6380 192.168.56.109 6380 @ mymaster 192.168.56.108 6379
3047:X 27 Jun 05:58:06.316 # +promoted-slave slave 192.168.56.109:6380 192.168.56.109 6380 @ mymaster 192.168.56.108 6379
3047:X 27 Jun 05:58:06.316 # +failover-state-reconf-slaves master mymaster 192.168.56.108 6379
3047:X 27 Jun 05:58:06.363 * +slave-reconf-sent slave 192.168.56.110:6381 192.168.56.110 6381 @ mymaster 192.168.56.108 6379
3047:X 27 Jun 05:58:07.026 * +slave-reconf-inprog slave 192.168.56.110:6381 192.168.56.110 6381 @ mymaster 192.168.56.108 6379
3047:X 27 Jun 05:58:08.050 * +slave-reconf-done slave 192.168.56.110:6381 192.168.56.110 6381 @ mymaster 192.168.56.108 6379
3047:X 27 Jun 05:58:08.117 # +failover-end master mymaster 192.168.56.108 6379
3047:X 27 Jun 05:58:08.117 # +switch-master mymaster 192.168.56.108 6379 192.168.56.109 6380
3047:X 27 Jun 05:58:08.117 * +slave slave 192.168.56.110:6381 192.168.56.110 6381 @ mymaster 192.168.56.109 6380
3047:X 27 Jun 05:58:08.117 * +slave slave 192.168.56.108:6379 192.168.56.108 6379 @ mymaster 192.168.56.109 6380
在节点3的log中,可以看到:
3018:X 27 Jun 05:58:06.395 # +new-epoch 17
3018:X 27 Jun 05:58:06.395 # +config-update-from sentinel be167fc5c77a14ef53996d367e237d3cc33a53b6 192.168.56.109 26380 @ mymaster 192.168.56.108 6379
3018:X 27 Jun 05:58:06.395 # +switch-master mymaster 192.168.56.108 6379 192.168.56.109 6380
3018:X 27 Jun 05:58:06.396 * +slave slave 192.168.56.110:6381 192.168.56.110 6381 @ mymaster 192.168.56.109 6380
3018:X 27 Jun 05:58:06.396 * +slave slave 192.168.56.108:6379 192.168.56.108 6379 @ mymaster 192.168.56.109 6380
三、Redis的分片和集群高可用架构
redis的高可用+分片技术,是通过redis cluster来实现的。一般情况下,如果单个或者主从结构,撑不住业务的需求,如单核CPU撑爆,或者内存使用过多,我们一般会将redis拆成多个分片。
1. Redis的分片技术,可以分成
1.1 redis原生分片:

1.2 proxy分片:
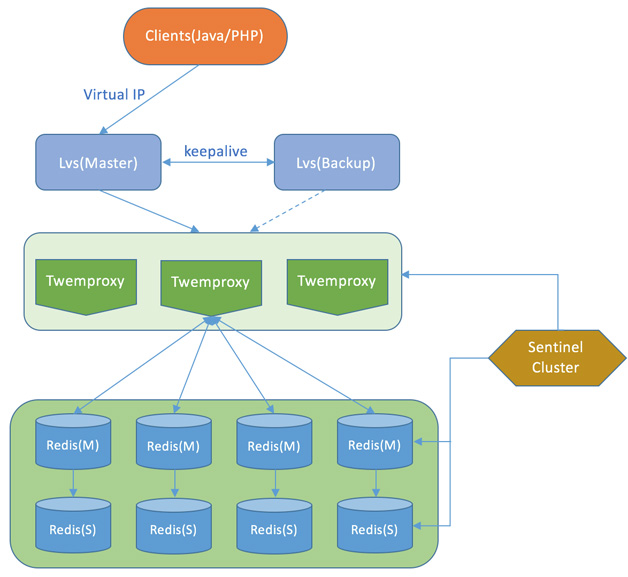
1.3 应用程序分片:
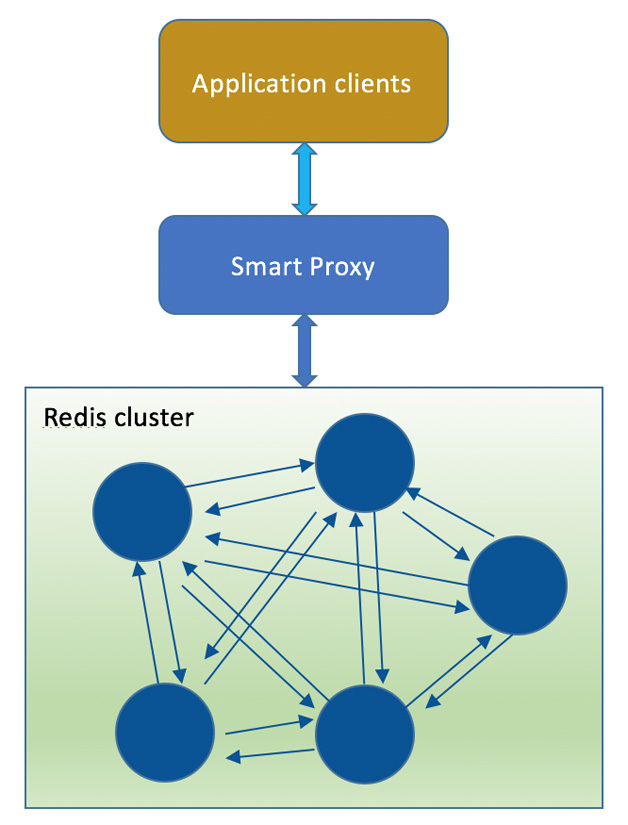
我们这里聊的是redis的原生分片,即redis cluster。它可以实现多主多从的架构,多从是为了给主在down掉的时候,实现切换。这个切换在cluster内提供,不需要在额外的使用sentinel。注意:redis集群需要至少6个节点,也就是六台服务器。如果服务器数量不足可在每台服务器上建立多个节点,如2台服务器,每台服务器上建立3个节点。
另外,由于redis cluster官方自带的redis-trib.rb工具不支持密码,因此在配置完成前,不能加密码。
Redis集群不能保证强一致性。产生写操作丢失的第一个原因,是因为主从节点之间使用了异步的方式来同步数据。
一个最小的集群需要最少3个主节点。建议配置至少6个节点:3个主节点和3个从节点。
2. 安装redis cluster:
redis cluster的管理工具是redis-trib。
2.1. 要运行redis-trib要先安装ruby运行环境:
yum -y install ruby
2.2. 接下来安装ruby gems,用它来查找、安装、升级和卸载ruby软件包:
yum -y install rubygems
2.3. 然后通过gem来安装ruby的redis客户端
gem install redis
这一步有可能会失败,大多是因为国内连不上gem官方库,那只能修改gem库为国内的源,如淘宝网的RubyGems镜像:
下面是换源操作:
# gem source -l
# gem source --remove http://rubygems.org/
# gem sources -a http://ruby.taobao.org/
# gem source -l

# gem install redis
2.4. 修改各个主机上的redis.conf文件,添加cluster选项:
集群配置:
cluster-enabled <yes/no>: 如果配置”yes”则开启集群功能,此redis实例作为集群的一个节点,否则,它是一个普通的单一的redis实例。
cluster-config-file : 注意:虽然此配置的名字叫“集群配置文件”,但是此配置文件不能人工编辑,它是集群节点自动维护的文件,主要用于记录集群中有哪些节点、他们的状态以及一些持久化参数等,方便在重启时恢复这些状态。通常是在收到请求之后这个文件就会被更新。
cluster-node-timeout : 这是集群中的节点能够失联的最大时间,超过这个时间,该节点就会被认为故障。如果主节点超过这个时间还是不可达,则用它的从节点将启动故障迁移,升级成主节点。注意,任何一个节点在这个时间之内如果还是没有连上大部分的主节点,则此节点将停止接收任何请求。
cluster-slave-validity-factor : 如果设置成0,则无论从节点与主节点失联多久,从节点都会尝试升级成主节点。如果设置成正数,则cluster-node-timeout乘以cluster-slave-validity-factor得到的时间,是从节点与主节点失联后,此从节点数据有效的最长时间,超过这个时间,从节点不会启动故障迁移。假设cluster-node-timeout=5,cluster-slave-validity-factor=10,则如果从节点跟主节点失联超过50秒,此从节点不能成为主节点。注意,如果此参数配置为非0,将可能出现由于某主节点失联却没有从节点能顶上的情况,从而导致集群不能正常工作,在这种情况下,只有等到原来的主节点重新回归到集群,集群才恢复运作。
cluster-migration-barrier :主节点需要的最小从节点数,只有达到这个数,主节点失败时,它从节点才会进行迁移。更详细介绍可以看本教程后面关于副本迁移到部分。
cluster-require-full-coverage <yes/no>:在部分key所在的节点不可用时,如果此参数设置为”yes”(默认值), 则整个集群停止接受操作;如果此参数设置为”no”,则集群依然为可达节点上的key提供读操作。
cluster-enabled yes
##注意各个主机的这个文件是不同的
cluster-config-file nodes-6379.conf
##表示超时5000毫秒,cluster就认为该节点下线,在大规模集群中(近1000个redis实例)集群间通信占用大量带宽资源,调整cluster-node-timeout 参数能有效降低带宽。
cluster-node-timeout 5000
##修改成允许所有网络连接
#bind 127.0.0.1
##取消protect mode
protected-mode no
##取消密码:
#masterauth oracleblog
#requirepass "oracleblog"
2.5. 我们分别在3个主机上启动6个实例:
192.168.56.108 : redis_6379.conf + redis_6389.conf
192.168.56.109 : redis_6380.conf + redis_6381.conf
192.168.56.110 : redis_6381.conf + redis_6391.conf
2.6. 创建cluster:
cp -p /root/redis_install/redis-3.2.9/src/redis-trib.rb /usr/local/bin/
[root@redis01 6379]# cd /usr/local/bin/
[root@redis01 bin]#
[root@redis01 bin]# ./redis-trib.rb create --replicas 1 192.168.56.108:6379 192.168.56.109:6380 192.168.56.110:6381 192.168.56.108:6389 192.168.56.109:6390 192.168.56.110:6391
>>> Creating cluster
>>> Performing hash slots allocation on 6 nodes...
Using 3 masters:
192.168.56.108:6379
192.168.56.109:6380
192.168.56.110:6381
Adding replica 192.168.56.109:6390 to 192.168.56.108:6379
Adding replica 192.168.56.108:6389 to 192.168.56.109:6380
Adding replica 192.168.56.110:6391 to 192.168.56.110:6381
M: 50df897b5bad63a525a8d46998b30d47698d9cd9 192.168.56.108:6379
   slots:0-5460 (5461 slots) master
M: 00974c9c1acede227f1ef25fd56460a1a19818a0 192.168.56.109:6380
   slots:5461-10922 (5462 slots) master
M: 632f31d57d6fcbf48e277ed8cd34299188d2c675 192.168.56.110:6381
   slots:10923-16383 (5461 slots) master
S: e73dc8caf474076fdbeb4da346333bc8410c8486 192.168.56.108:6389
   replicates 00974c9c1acede227f1ef25fd56460a1a19818a0
S: 9e112eed7f8a5830e907d97792c50a2171d9f13b 192.168.56.109:6390
   replicates 50df897b5bad63a525a8d46998b30d47698d9cd9
S: 3005c5adea38cc21cf47fb86cbe1e8cfd1cbfce7 192.168.56.110:6391
   replicates 632f31d57d6fcbf48e277ed8cd34299188d2c675
Can I set the above configuration? (type 'yes' to accept): yes
>>> Nodes configuration updated
>>> Assign a different config epoch to each node
>>> Sending CLUSTER MEET messages to join the cluster
Waiting for the cluster to join...
>>> Performing Cluster Check (using node 192.168.56.108:6379)
M: 50df897b5bad63a525a8d46998b30d47698d9cd9 192.168.56.108:6379
   slots:0-5460 (5461 slots) master
   1 additional replica(s)
S: 9e112eed7f8a5830e907d97792c50a2171d9f13b 192.168.56.109:6390
   slots: (0 slots) slave
   replicates 50df897b5bad63a525a8d46998b30d47698d9cd9
M: 00974c9c1acede227f1ef25fd56460a1a19818a0 192.168.56.109:6380
   slots:5461-10922 (5462 slots) master
   1 additional replica(s)
S: e73dc8caf474076fdbeb4da346333bc8410c8486 192.168.56.108:6389
   slots: (0 slots) slave
   replicates 00974c9c1acede227f1ef25fd56460a1a19818a0
S: 3005c5adea38cc21cf47fb86cbe1e8cfd1cbfce7 192.168.56.110:6391
   slots: (0 slots) slave
   replicates 632f31d57d6fcbf48e277ed8cd34299188d2c675
M: 632f31d57d6fcbf48e277ed8cd34299188d2c675 192.168.56.110:6381
   slots:10923-16383 (5461 slots) master
   1 additional replica(s)
[OK] All nodes agree about slots configuration.
>>> Check for open slots...
>>> Check slots coverage...
[OK] All 16384 slots covered.
[root@redis01 bin]#
replicas表示需要有几个slave–replicas 1 表示 自动为每一个master节点分配一个slave节点 上面有6个节点,程序会按照一定规则生成 3个master(主),3个slave(从) 。
注,如果遇到ERR Slot xxxx is already busy (Redis::CommandError)的报错,就按照下面的方法解决:
1. 删除所有node_xxxx.conf文件
2. redis-cli -p xxxx flushall
3.redis-cli -p xxxx cluster reset soft
我们来插入数据:
1. 先检查一下哪个是master:
[root@redis01 bin]# ./redis-trib.rb check 192.168.56.108:6379
>>> Performing Cluster Check (using node 192.168.56.108:6379)
S: 50df897b5bad63a525a8d46998b30d47698d9cd9 192.168.56.108:6379
   slots: (0 slots) slave
   replicates 9e112eed7f8a5830e907d97792c50a2171d9f13b
M: 632f31d57d6fcbf48e277ed8cd34299188d2c675 192.168.56.110:6381
   slots:10923-16383 (5461 slots) master
   1 additional replica(s)
M: 00974c9c1acede227f1ef25fd56460a1a19818a0 192.168.56.109:6380
   slots:5461-10922 (5462 slots) master
   1 additional replica(s)
S: 3005c5adea38cc21cf47fb86cbe1e8cfd1cbfce7 192.168.56.110:6391
   slots: (0 slots) slave
   replicates 632f31d57d6fcbf48e277ed8cd34299188d2c675
M: 9e112eed7f8a5830e907d97792c50a2171d9f13b 192.168.56.109:6390
   slots:0-5460 (5461 slots) master
   1 additional replica(s)
S: e73dc8caf474076fdbeb4da346333bc8410c8486 192.168.56.108:6389
   slots: (0 slots) slave
   replicates 00974c9c1acede227f1ef25fd56460a1a19818a0
[OK] All nodes agree about slots configuration.
>>> Check for open slots...
>>> Check slots coverage...
[OK] All 16384 slots covered.
[root@redis01 bin]#
或者下面的命令也可以:
[root@redis01 bin]# redis-cli -p 6389 cluster nodes
9e112eed7f8a5830e907d97792c50a2171d9f13b 192.168.56.109:6390 master - 0 1498756230880 7 connected 0-5460
00974c9c1acede227f1ef25fd56460a1a19818a0 192.168.56.109:6380 master - 0 1498756231884 2 connected 5461-10922
50df897b5bad63a525a8d46998b30d47698d9cd9 192.168.56.108:6379 slave 9e112eed7f8a5830e907d97792c50a2171d9f13b 0 1498756231381 7 connected
632f31d57d6fcbf48e277ed8cd34299188d2c675 192.168.56.110:6381 master - 0 1498756230377 3 connected 10923-16383
e73dc8caf474076fdbeb4da346333bc8410c8486 192.168.56.108:6389 myself,slave 00974c9c1acede227f1ef25fd56460a1a19818a0 0 0 4 connected
3005c5adea38cc21cf47fb86cbe1e8cfd1cbfce7 192.168.56.110:6391 slave 632f31d57d6fcbf48e277ed8cd34299188d2c675 0 1498756231381 6 connected
[root@redis01 bin]#
2. 我们登录192.168.56.109:6390进行操作:
[root@redis01 bin]# redis-cli -h 192.168.56.109 -p 6390 -c
192.168.56.109:6390> keys *
(empty list or set)
192.168.56.109:6390> set name myname1
-> Redirected to slot [5798] located at 192.168.56.109:6380
OK
192.168.56.109:6380>
注意,这里的redis-cli要用-c参数。不然会报错:
192.168.56.108:6379> set name myname1
(error) MOVED 5798 192.168.56.109:6380
192.168.56.108:6379>
3. 我们来尝试添加节点:
3.1. 先启2个redis实例,实例参数参考原来已经在跑的实例。
3.2. 添加一个实例到cluster,注意,这个是作为master的节点加进去的。
[root@redis01 bin]# pwd
/usr/local/bin
[root@redis01 bin]# ./redis-trib.rb add-node 192.168.56.108:6399 192.168.56.108:6379
>>> Adding node 192.168.56.108:6399 to cluster 192.168.56.108:6379
>>> Performing Cluster Check (using node 192.168.56.108:6379)
S: 50df897b5bad63a525a8d46998b30d47698d9cd9 192.168.56.108:6379
   slots: (0 slots) slave
   replicates 9e112eed7f8a5830e907d97792c50a2171d9f13b
S: e73dc8caf474076fdbeb4da346333bc8410c8486 192.168.56.108:6389
   slots: (0 slots) slave
   replicates 00974c9c1acede227f1ef25fd56460a1a19818a0
M: 00974c9c1acede227f1ef25fd56460a1a19818a0 192.168.56.109:6380
   slots:5461-10922 (5462 slots) master
   1 additional replica(s)
S: 3005c5adea38cc21cf47fb86cbe1e8cfd1cbfce7 192.168.56.110:6391
   slots: (0 slots) slave
   replicates 632f31d57d6fcbf48e277ed8cd34299188d2c675
M: 632f31d57d6fcbf48e277ed8cd34299188d2c675 192.168.56.110:6381
   slots:10923-16383 (5461 slots) master
   1 additional replica(s)
M: 9e112eed7f8a5830e907d97792c50a2171d9f13b 192.168.56.109:6390
   slots:0-5460 (5461 slots) master
   1 additional replica(s)
[OK] All nodes agree about slots configuration.
>>> Check for open slots...
>>> Check slots coverage...
[OK] All 16384 slots covered.
>>> Send CLUSTER MEET to node 192.168.56.108:6399 to make it join the cluster.
[OK] New node added correctly.
[root@redis01 bin]#
[root@redis01 bin]#   redis-cli -p 6389 cluster nodes |grep 6399
df5bf5d030453acddd4db106fda76a1d1687a22f 192.168.56.108:6399 master - 0 1498814734265 0 connected
[root@redis01 bin]#
注意这里的df5bf5d030453acddd4db106fda76a1d1687a22f ,我们一会会用到。
添加从节点,注意我们这里用到了刚刚的主节点的mast id
[root@redis01 bin]# ./redis-trib.rb add-node --slave --master-id  df5bf5d030453acddd4db106fda76a1d1687a22f 192.168.56.109:6370 192.168.56.108:6399
>>> Adding node 192.168.56.109:6370 to cluster 192.168.56.108:6399
>>> Performing Cluster Check (using node 192.168.56.108:6399)
M: df5bf5d030453acddd4db106fda76a1d1687a22f 192.168.56.108:6399
   slots: (0 slots) master
   0 additional replica(s)
M: 632f31d57d6fcbf48e277ed8cd34299188d2c675 192.168.56.110:6381
   slots:10923-16383 (5461 slots) master
   1 additional replica(s)
S: 50df897b5bad63a525a8d46998b30d47698d9cd9 192.168.56.108:6379
   slots: (0 slots) slave
   replicates 9e112eed7f8a5830e907d97792c50a2171d9f13b
S: e73dc8caf474076fdbeb4da346333bc8410c8486 192.168.56.108:6389
   slots: (0 slots) slave
   replicates 00974c9c1acede227f1ef25fd56460a1a19818a0
S: 3005c5adea38cc21cf47fb86cbe1e8cfd1cbfce7 192.168.56.110:6391
   slots: (0 slots) slave
   replicates 632f31d57d6fcbf48e277ed8cd34299188d2c675
M: 9e112eed7f8a5830e907d97792c50a2171d9f13b 192.168.56.109:6390
   slots:0-5460 (5461 slots) master
   1 additional replica(s)
M: 00974c9c1acede227f1ef25fd56460a1a19818a0 192.168.56.109:6380
   slots:5461-10922 (5462 slots) master
   1 additional replica(s)
[OK] All nodes agree about slots configuration.
>>> Check for open slots...
>>> Check slots coverage...
[OK] All 16384 slots covered.
>>> Send CLUSTER MEET to node 192.168.56.109:6370 to make it join the cluster.
Waiting for the cluster to join...
>>> Configure node as replica of 192.168.56.108:6399.
[OK] New node added correctly.
[root@redis01 bin]#
4. 添加完之后,数据并没有重新分布,我们需要reshard。
重新分片命令:
交互式:
/redis-trib.rb reshard [host]:[port]
非交互式:
./redis-trib.rb reshard –from [node-id] –to [node-id] –slots [number of slots] –yes [host]:[port]
注意看下面那些master中0 slot的部分:
[root@redis01 bin]# ./redis-trib.rb check 192.168.56.108:6379
>>> Performing Cluster Check (using node 192.168.56.108:6379)
S: 50df897b5bad63a525a8d46998b30d47698d9cd9 192.168.56.108:6379
   slots: (0 slots) slave
   replicates 9e112eed7f8a5830e907d97792c50a2171d9f13b
M: df5bf5d030453acddd4db106fda76a1d1687a22f 192.168.56.108:6399
   slots: (0 slots) master
   1 additional replica(s)
S: e73dc8caf474076fdbeb4da346333bc8410c8486 192.168.56.108:6389
   slots: (0 slots) slave
   replicates 00974c9c1acede227f1ef25fd56460a1a19818a0
M: 00974c9c1acede227f1ef25fd56460a1a19818a0 192.168.56.109:6380
   slots:5461-10922 (5462 slots) master
   1 additional replica(s)
S: 3005c5adea38cc21cf47fb86cbe1e8cfd1cbfce7 192.168.56.110:6391
   slots: (0 slots) slave
   replicates 632f31d57d6fcbf48e277ed8cd34299188d2c675
M: 632f31d57d6fcbf48e277ed8cd34299188d2c675 192.168.56.110:6381
   slots:10923-16383 (5461 slots) master
   1 additional replica(s)
M: 9e112eed7f8a5830e907d97792c50a2171d9f13b 192.168.56.109:6390
   slots:0-5460 (5461 slots) master
   1 additional replica(s)
S: a724660e17bf5dbfd7266f33ed37d5eb952dd3d0 192.168.56.109:6370
   slots: (0 slots) slave
   replicates df5bf5d030453acddd4db106fda76a1d1687a22f
[OK] All nodes agree about slots configuration.
>>> Check for open slots...
>>> Check slots coverage...
[OK] All 16384 slots covered.
[root@redis01 bin]#
[root@redis01 bin]# ./redis-trib.rb reshard 192.168.56.108:6399
>>> Performing Cluster Check (using node 192.168.56.108:6399)
M: df5bf5d030453acddd4db106fda76a1d1687a22f 192.168.56.108:6399
   slots: (0 slots) master
   1 additional replica(s)
M: 632f31d57d6fcbf48e277ed8cd34299188d2c675 192.168.56.110:6381
   slots:10923-16383 (5461 slots) master
   1 additional replica(s)
S: 50df897b5bad63a525a8d46998b30d47698d9cd9 192.168.56.108:6379
   slots: (0 slots) slave
   replicates 9e112eed7f8a5830e907d97792c50a2171d9f13b
S: e73dc8caf474076fdbeb4da346333bc8410c8486 192.168.56.108:6389
   slots: (0 slots) slave
   replicates 00974c9c1acede227f1ef25fd56460a1a19818a0
S: 3005c5adea38cc21cf47fb86cbe1e8cfd1cbfce7 192.168.56.110:6391
   slots: (0 slots) slave
   replicates 632f31d57d6fcbf48e277ed8cd34299188d2c675
M: 9e112eed7f8a5830e907d97792c50a2171d9f13b 192.168.56.109:6390
   slots:0-5460 (5461 slots) master
   1 additional replica(s)
M: 00974c9c1acede227f1ef25fd56460a1a19818a0 192.168.56.109:6380
   slots:5461-10922 (5462 slots) master
   1 additional replica(s)
S: a724660e17bf5dbfd7266f33ed37d5eb952dd3d0 192.168.56.109:6370
   slots: (0 slots) slave
   replicates df5bf5d030453acddd4db106fda76a1d1687a22f
[OK] All nodes agree about slots configuration.
>>> Check for open slots...
>>> Check slots coverage...
[OK] All 16384 slots covered.
How many slots do you want to move (from 1 to 16384)? 4096
What is the receiving node ID? df5bf5d030453acddd4db106fda76a1d1687a22f
Please enter all the source node IDs.
  Type 'all' to use all the nodes as source nodes for the hash slots.
  Type 'done' once you entered all the source nodes IDs.
Source node #1:all

Ready to move 4096 slots.
  Source nodes:
    M: 632f31d57d6fcbf48e277ed8cd34299188d2c675 192.168.56.110:6381
   slots:10923-16383 (5461 slots) master
   1 additional replica(s)
    M: 9e112eed7f8a5830e907d97792c50a2171d9f13b 192.168.56.109:6390
   slots:0-5460 (5461 slots) master
   1 additional replica(s)
    M: 00974c9c1acede227f1ef25fd56460a1a19818a0 192.168.56.109:6380
   slots:5461-10922 (5462 slots) master
   1 additional replica(s)
  Destination node:
    M: df5bf5d030453acddd4db106fda76a1d1687a22f 192.168.56.108:6399
   slots: (0 slots) master
   1 additional replica(s)
  Resharding plan:
    Moving slot 5461 from 00974c9c1acede227f1ef25fd56460a1a19818a0
    Moving slot 5462 from 00974c9c1acede227f1ef25fd56460a1a19818a0
    Moving slot 5463 from 00974c9c1acede227f1ef25fd56460a1a19818a0
    Moving slot 5464 from 00974c9c1acede227f1ef25fd56460a1a19818a0
    Moving slot 5465 from 00974c9c1acede227f1ef25fd56460a1a19818a0
    Moving slot 5466 from 00974c9c1acede227f1ef25fd56460a1a19818a0
    ……
    Moving slot 12285 from 192.168.56.110:6381 to 192.168.56.108:6399:
    Moving slot 12286 from 192.168.56.110:6381 to 192.168.56.108:6399:
    Moving slot 12287 from 192.168.56.110:6381 to 192.168.56.108:6399:
[root@redis01 bin]#
再次检查reshard之后的情况,可以看到每个master基本都分到了4096个slot。(因为总共16384 个slot,现在有4个master,如果平均分配,那么每个4096个slots。)
[root@redis01 bin]# ./redis-trib.rb check 192.168.56.108:6379
>>> Performing Cluster Check (using node 192.168.56.108:6379)
S: 50df897b5bad63a525a8d46998b30d47698d9cd9 192.168.56.108:6379
   slots: (0 slots) slave
   replicates 9e112eed7f8a5830e907d97792c50a2171d9f13b
M: df5bf5d030453acddd4db106fda76a1d1687a22f 192.168.56.108:6399
   slots:0-1364,5461-6826,10923-12287 (4096 slots) master
   1 additional replica(s)
S: e73dc8caf474076fdbeb4da346333bc8410c8486 192.168.56.108:6389
   slots: (0 slots) slave
   replicates 00974c9c1acede227f1ef25fd56460a1a19818a0
M: 00974c9c1acede227f1ef25fd56460a1a19818a0 192.168.56.109:6380
   slots:6827-10922 (4096 slots) master
   1 additional replica(s)
S: 3005c5adea38cc21cf47fb86cbe1e8cfd1cbfce7 192.168.56.110:6391
   slots: (0 slots) slave
   replicates 632f31d57d6fcbf48e277ed8cd34299188d2c675
M: 632f31d57d6fcbf48e277ed8cd34299188d2c675 192.168.56.110:6381
   slots:12288-16383 (4096 slots) master
   1 additional replica(s)
M: 9e112eed7f8a5830e907d97792c50a2171d9f13b 192.168.56.109:6390
   slots:1365-5460 (4096 slots) master
   1 additional replica(s)
S: a724660e17bf5dbfd7266f33ed37d5eb952dd3d0 192.168.56.109:6370
   slots: (0 slots) slave
   replicates df5bf5d030453acddd4db106fda76a1d1687a22f
[OK] All nodes agree about slots configuration.
>>> Check for open slots...
>>> Check slots coverage...
[OK] All 16384 slots covered.
[root@redis01 bin]#
5. 删除节点。步骤相反:删除从节点,reshard数据去不用删除的节点,删除主节点。
删除从节点:
[root@redis01 bin]# ./redis-trib.rb del-node 192.168.56.109:6370 'a724660e17bf5dbfd7266f33ed37d5eb952dd3d0'
>>> Removing node a724660e17bf5dbfd7266f33ed37d5eb952dd3d0 from cluster 192.168.56.109:6370
>>> Sending CLUSTER FORGET messages to the cluster...
>>> SHUTDOWN the node.
[root@redis01 bin]#
[root@redis01 bin]#
reshard数据:
[root@redis01 bin]# ./redis-trib.rb check 192.168.56.108:6379
>>> Performing Cluster Check (using node 192.168.56.108:6379)
S: 50df897b5bad63a525a8d46998b30d47698d9cd9 192.168.56.108:6379
   slots: (0 slots) slave
   replicates 9e112eed7f8a5830e907d97792c50a2171d9f13b
M: df5bf5d030453acddd4db106fda76a1d1687a22f 192.168.56.108:6399
   slots:0-1364,5461-6826,10923-12287 (4096 slots) master
   0 additional replica(s)
S: e73dc8caf474076fdbeb4da346333bc8410c8486 192.168.56.108:6389
   slots: (0 slots) slave
   replicates 00974c9c1acede227f1ef25fd56460a1a19818a0
M: 00974c9c1acede227f1ef25fd56460a1a19818a0 192.168.56.109:6380
   slots:6827-10922 (4096 slots) master
   1 additional replica(s)
S: 3005c5adea38cc21cf47fb86cbe1e8cfd1cbfce7 192.168.56.110:6391
   slots: (0 slots) slave
   replicates 632f31d57d6fcbf48e277ed8cd34299188d2c675
M: 632f31d57d6fcbf48e277ed8cd34299188d2c675 192.168.56.110:6381
   slots:12288-16383 (4096 slots) master
   1 additional replica(s)
M: 9e112eed7f8a5830e907d97792c50a2171d9f13b 192.168.56.109:6390
   slots:1365-5460 (4096 slots) master
   1 additional replica(s)
[OK] All nodes agree about slots configuration.
>>> Check for open slots...
>>> Check slots coverage...
[OK] All 16384 slots covered.
[root@redis01 bin]#
[root@redis01 bin]#
[root@redis01 bin]# ./redis-trib.rb reshard 192.168.56.108:6399
>>> Performing Cluster Check (using node 192.168.56.108:6399)
M: df5bf5d030453acddd4db106fda76a1d1687a22f 192.168.56.108:6399
   slots:0-1364,5461-6826,10923-12287 (4096 slots) master
   0 additional replica(s)
M: 632f31d57d6fcbf48e277ed8cd34299188d2c675 192.168.56.110:6381
   slots:12288-16383 (4096 slots) master
   1 additional replica(s)
S: 50df897b5bad63a525a8d46998b30d47698d9cd9 192.168.56.108:6379
   slots: (0 slots) slave
   replicates 9e112eed7f8a5830e907d97792c50a2171d9f13b
S: e73dc8caf474076fdbeb4da346333bc8410c8486 192.168.56.108:6389
   slots: (0 slots) slave
   replicates 00974c9c1acede227f1ef25fd56460a1a19818a0
S: 3005c5adea38cc21cf47fb86cbe1e8cfd1cbfce7 192.168.56.110:6391
   slots: (0 slots) slave
   replicates 632f31d57d6fcbf48e277ed8cd34299188d2c675
M: 9e112eed7f8a5830e907d97792c50a2171d9f13b 192.168.56.109:6390
   slots:1365-5460 (4096 slots) master
   1 additional replica(s)
M: 00974c9c1acede227f1ef25fd56460a1a19818a0 192.168.56.109:6380
   slots:6827-10922 (4096 slots) master
   1 additional replica(s)
[OK] All nodes agree about slots configuration.
>>> Check for open slots...
>>> Check slots coverage...
[OK] All 16384 slots covered.
How many slots do you want to move (from 1 to 16384)? 4096
What is the receiving node ID? 9e112eed7f8a5830e907d97792c50a2171d9f13b //接受者的master id
Please enter all the source node IDs.
  Type 'all' to use all the nodes as source nodes for the hash slots.
  Type 'done' once you entered all the source nodes IDs.
Source node #1:df5bf5d030453acddd4db106fda76a1d1687a22f //需要被删除的master id
Source node #2:done
检查已经是0 slot
[root@redis01 bin]# ./redis-trib.rb check 192.168.56.108:6379
>>> Performing Cluster Check (using node 192.168.56.108:6379)
S: 50df897b5bad63a525a8d46998b30d47698d9cd9 192.168.56.108:6379
   slots: (0 slots) slave
   replicates 9e112eed7f8a5830e907d97792c50a2171d9f13b
M: df5bf5d030453acddd4db106fda76a1d1687a22f 192.168.56.108:6399
   slots: (0 slots) master
   0 additional replica(s)
S: e73dc8caf474076fdbeb4da346333bc8410c8486 192.168.56.108:6389
   slots: (0 slots) slave
   replicates 00974c9c1acede227f1ef25fd56460a1a19818a0
M: 00974c9c1acede227f1ef25fd56460a1a19818a0 192.168.56.109:6380
   slots:8192-10922 (2731 slots) master
   1 additional replica(s)
S: 3005c5adea38cc21cf47fb86cbe1e8cfd1cbfce7 192.168.56.110:6391
   slots: (0 slots) slave
   replicates 632f31d57d6fcbf48e277ed8cd34299188d2c675
M: 632f31d57d6fcbf48e277ed8cd34299188d2c675 192.168.56.110:6381
   slots:13654-16383 (2730 slots) master
   1 additional replica(s)
M: 9e112eed7f8a5830e907d97792c50a2171d9f13b 192.168.56.109:6390
   slots:0-8191,10923-13653 (10923 slots) master
   1 additional replica(s)
[OK] All nodes agree about slots configuration.
>>> Check for open slots...
>>> Check slots coverage...
[OK] All 16384 slots covered.
[root@redis01 bin]#
[root@redis01 bin]#
[root@redis01 bin]# ./redis-trib.rb del-node 192.168.56.108:6399 'df5bf5d030453acddd4db106fda76a1d1687a22f'
>>> Removing node df5bf5d030453acddd4db106fda76a1d1687a22f from cluster 192.168.56.108:6399
>>> Sending CLUSTER FORGET messages to the cluster...
>>> SHUTDOWN the node.
[root@redis01 bin]#
删除确认没有slot的主节点
[root@redis01 bin]#
[root@redis01 bin]# ./redis-trib.rb del-node 192.168.56.108:6399 'df5bf5d030453acddd4db106fda76a1d1687a22f'
>>> Removing node df5bf5d030453acddd4db106fda76a1d1687a22f from cluster 192.168.56.108:6399
>>> Sending CLUSTER FORGET messages to the cluster...
>>> SHUTDOWN the node.
[root@redis01 bin]#
四. Redis的监控:
Redis的监控,主要还是从info命令的返回结果看。
1. 内存使用
如果 Redis 使用的内存超出了可用的物理内存大小,那么 Redis 很可能系统会被 OOM Killer 杀掉。针对这一点,你可以通过 info 命令对 used_memory 和 used_memory_peak 进行监控,为使用内存量设定阈值,并设定相应的报警机制。当然,报警只是手段,重要的是你得预先计划好,当内存使用量过大后,你应该做些什么,是清除一些没用的冷数据,还是把 Redis 迁移到更强大的机器上去。
# Memory
used_memory:822504
used_memory_human:803.23K
used_memory_rss:3960832
used_memory_rss_human:3.78M
used_memory_peak:822504
used_memory_peak_human:803.23K
total_system_memory:16803835904
total_system_memory_human:15.65G
used_memory_lua:37888
used_memory_lua_human:37.00K
maxmemory:0
maxmemory_human:0B
maxmemory_policy:noeviction
mem_fragmentation_ratio:4.82
mem_allocator:jemalloc-4.0.3
2. 持久化
如果因为你的机器或 Redis 本身的问题导致 Redis 崩溃了,那么你唯一的救命稻草可能就是 dump 出来的 rdb文件了,所以,对 Redis dump 文件进行监控也是很重要的。你可以通过对 rdb_last_save_time 进行监控,了解你最近一次 dump 数据操作的时间,还可以通过对 rdb_changes_since_last_save 进行监控来知道如果这时候出现故障,你会丢失多少数据。
# Persistence
loading:0
rdb_changes_since_last_save:35
rdb_bgsave_in_progress:0
rdb_last_save_time:1498833577
rdb_last_bgsave_status:ok
rdb_last_bgsave_time_sec:-1
rdb_current_bgsave_time_sec:-1
aof_enabled:1
aof_rewrite_in_progress:0
aof_rewrite_scheduled:0
aof_last_rewrite_time_sec:-1
aof_current_rewrite_time_sec:-1
aof_last_bgrewrite_status:ok
aof_last_write_status:ok
aof_current_size:1621
aof_base_size:1621
aof_pending_rewrite:0
aof_buffer_length:0
aof_rewrite_buffer_length:0
aof_pending_bio_fsync:0
aof_delayed_fsync:0
3. 主从复制
如果你设置了主从复制模式,那么你最好对复制的情况是否正常做一些监控,主要是对 info 输出中的 master_link_status 进行监控,如果这个值是 up,那么说明同步正常,如果是 down,那么你就要注意一下输出的其它一些诊断信息了。
# Replication
role:slave
master_host:192.168.56.109
master_port:6380
master_link_status:up
master_last_io_seconds_ago:3
master_sync_in_progress:0
slave_repl_offset:3011
slave_priority:100
slave_read_only:1
connected_slaves:0
master_repl_offset:0
repl_backlog_active:0
repl_backlog_size:1048576
repl_backlog_first_byte_offset:0
repl_backlog_histlen:0
4. Fork 性能
当 Redis 持久化数据到磁盘上时,它会进行一次 fork 操作,通过 fork 对内存的 copy on write 机制最廉价的实现内存镜像。但是虽然内存是 copy on write 的,但是虚拟内存表是在 fork 的瞬间就需要分配,所以 fork 会造成主线程短时间的卡顿(停止所有读写操作),这个卡顿时间和当前 Redis 的内存使用量有关。通常 GB 量级的 Redis 进行 fork 操作的时间在毫秒级。你可以通过对 info 输出的 latest_fork_usec 进行监控来了解最近一次 fork 操作导致了多少时间的卡顿。
# Stats
total_connections_received:1
total_commands_processed:16
instantaneous_ops_per_sec:0
total_net_input_bytes:477
total_net_output_bytes:6000613
instantaneous_input_kbps:0.00
instantaneous_output_kbps:0.00
rejected_connections:0
sync_full:0
sync_partial_ok:0
sync_partial_err:0
expired_keys:0
evicted_keys:0
keyspace_hits:0
keyspace_misses:0
pubsub_channels:0
pubsub_patterns:0
latest_fork_usec:206
migrate_cached_sockets:0
5. 配置一致
Redis 支持使用 CONFIG SET 操作来实现运行实的配置修改,这很方便,但同时也会导致一个问题。就是通过这个命令动态修改的配置,是不会同步到你的配置文件中去的。所以当你因为某些原因重启 Redis 时,你使用 CONFIG SET 做的配置修改就会丢失掉,所以我们最好保证在每次使用 CONFIG SET 修改配置时,也把配置文件一起相应地改掉。为了防止人为的失误,所以我们最好对配置进行监控,使用 CONFIG GET 命令来获取当前运行时的配置,并与 redis.conf 中的配置值进行对比,如果发现两边对不上,就启动报警。
6. 监控服务
-Sentinel
Sentinel 是 Redis 自带的工具,它可以对 Redis 主从复制进行监控,并实现主挂掉之后的自动故障转移。在转移的过程中,它还可以被配置去执行一个用户自定义的脚本,在脚本中我们就能够实现报警通知等功能
-Redis Live
Redis Live 是一个更通用的 Redis 监控方案,它的原理是定时在 Redis 上执行 MONITOR 命令,来获取当前 Redis 当前正在执行的命令,并通过统计分析,生成web页面的可视化分析报表。
7. 数据分布
弄清 Redis 中数据存储分布是一件很难的是,比如你想知道哪类型的 key 值占用内存最多。下面是一些工具,可以帮助你对 Redis 的数据集进行分析。
-Redis-sampler
Redis-sampler 是 Redis 作者开发的工具,它通过采样的方法,能够让你了解到当前Redis 中的数据的大致类型,数据及分布状况。
-Redis-audit
Redis-audit 是一个脚本,通过它,我们可以知道每一类 key 对内存的使用量。它可以提供的数据有:某一类 key 值的访问频率如何,有多少值设置了过期时间,某一类 key 值使用内存的大小,这很方便让我们能排查哪些 key 不常用或者压根不用。

-Redis-rdb-tools
Redis-rdb-tools 跟 Redis-audit 功能类似,不同的是它是通过对 rdb 文件进行分析来取得统计数据的。
五、Redis的Docker化:
1.docker上安装redis
先search一下有哪些redis:
LoveHousedeiMac:~ lovehouse$ docker search redis
NAME                      DESCRIPTION                                     STARS     OFFICIAL   AUTOMATED
redis                     Redis is an open source key-value store th...   3866      [OK]
sameersbn/redis                                                           54                   [OK]
bitnami/redis             Bitnami Redis Docker Image                      50                   [OK]
torusware/speedus-redis   Always updated official Redis docker image...   32                   [OK]
webhippie/redis           Docker images for redis                         7                    [OK]
anapsix/redis             11MB Redis server image over AlpineLinux        6                    [OK]
williamyeh/redis          Redis image for Docker                          3                    [OK]
clue/redis-benchmark      A minimal docker image to ease running the...   3                    [OK]
unblibraries/redis        Leverages phusion/baseimage to deploy a ba...   2                    [OK]
abzcoding/tomcat-redis    a tomcat container with redis as session m...   2                    [OK]
miko2u/redis              Redis                                           1                    [OK]
greytip/redis             redis 3.0.3                                     1                    [OK]
frodenas/redis            A Docker Image for Redis                        1                    [OK]
xataz/redis               Light redis image                               1                    [OK]
nanobox/redis             Redis service for nanobox.io                    0                    [OK]
maestrano/redis           Redis is an open source key-value store th...   0                    [OK]
cloudposse/redis          Standalone redis service                        0                    [OK]
watsco/redis              Watsco redis base                               0                    [OK]
appelgriebsch/redis       Configurable redis container based on Alpi...   0                    [OK]
maxird/redis              Redis                                           0                    [OK]
trelllis/redis            Redis Primary                                   0                    [OK]
drupaldocker/redis        Redis for Drupal                                0                    [OK]
yfix/redis                Yfix docker redis                               0                    [OK]
higebu/redis-commander    Redis Commander Docker image. https://gith...   0                    [OK]
continuouspipe/redis      Redis                                           0                    [OK]
LoveHousedeiMac:~ lovehouse$
开始pull镜像:
LoveHousedeiMac:~ lovehouse$ docker pull redis:latest
latest: Pulling from library/redis
23e3d0773492: Pull complete
bc8f870e2eab: Pull complete
9fb63685a3db: Pull complete
7d5f2d3e9188: Pull complete
4b386c0238f4: Pull complete
33c08d492082: Pull complete
Digest: sha256:6022356f9d729c858000fc10fc1b09d1624ba099227a0c5d314f7461c2fe6020
Status: Downloaded newer image for redis:latest
LoveHousedeiMac:~ lovehouse$
建议pull的时候,选择一个比较好的fuckgfw网络,不然总是会报错:
error pulling image configuration: Get https://dseasb33srnrn.cloudfront.net/registry-v2/docker/registry/v2/blobs/sha256/83/83744227b191fbc32e3bcb293c1b90ecdb86b3636d02b1a0db009effb3a5b8de/data?Expires=1497887535&Signature=aVLHPVuNv4zjReHDu8ZLum23CgZrSJkmU1~WZzy1mOQdcYu1gVvepxZeV4j44DCCfvM56VCewGzl7FFdNxev4Mtm~KpmKJjHFNQtavJNmu1nqx4MEhdjJNKWX8KNeFuL-euTU7hCwVzrzUs8OIeGO3RKhiva7w0KIFc7ql-xHC8_&Key-Pair-Id=APKAJECH5M7VWIS5YZ6Q: net/http: TLS handshake timeout
安装并启动redis,且设置appendonly为yes,注意我们这里把容器内的/data目录映射到本地目录/Users/[username]/redisdata下,用于做持久化:
LoveHousedeiMac:~ lovehouse$ docker run -p 6379:6379 -v /Users/lovehouse/redisdata:/data  -d redis:latest redis-server --appendonly yes
1fa497550b7e232eee63e050ff5e0f12c530aee992c158138af75b9442c7403f
LoveHousedeiMac:~ lovehouse$
LoveHousedeiMac:~ lovehouse$ docker ps
CONTAINER ID        IMAGE               COMMAND                  CREATED             STATUS              PORTS                    NAMES
1fa497550b7e        redis:latest        "docker-entrypoint..."   5 seconds ago       Up 6 seconds        0.0.0.0:6379->6379/tcp   pensive_sinoussi
LoveHousedeiMac:~ lovehouse$
LoveHousedeiMac:~ lovehouse$ docker ps -a
CONTAINER ID        IMAGE                         COMMAND                  CREATED             STATUS                        PORTS                    NAMES
1fa497550b7e        redis:latest                  "docker-entrypoint..."   15 seconds ago      Up 16 seconds                 0.0.0.0:6379->6379/tcp   pensive_sinoussi
c9f09116cc83        oracle/database:12.2.0.1-ee   "/bin/sh -c 'exec ..."   4 weeks ago         Exited (137) 42 minutes ago                            oracle
LoveHousedeiMac:~ lovehouse$
登录redis主机后运行redis-cli:
LoveHousedeiMac:~ lovehouse$ docker exec -it 1fa497550b7e /bin/bash
root@1fa497550b7e:/data#
root@1fa497550b7e:/data#
root@1fa497550b7e:/data# redis-cli
127.0.0.1:6379>
127.0.0.1:6379>
127.0.0.1:6379> info
# Server
redis_version:3.2.9
redis_git_sha1:00000000
redis_git_dirty:0
redis_build_id:d837dd4aae3a6933
redis_mode:standalone
os:Linux 4.9.27-moby x86_64
arch_bits:64
multiplexing_api:epoll
gcc_version:4.9.2
process_id:1
run_id:a490709296a4a15606af8650b4ae2eb922de81ff
tcp_port:6379
uptime_in_seconds:135
uptime_in_days:0
hz:10
lru_clock:4716607
executable:/data/redis-server
config_file:

# Clients
connected_clients:1
client_longest_output_list:0
client_biggest_input_buf:0
blocked_clients:0

# Memory
used_memory:822232
used_memory_human:802.96K
used_memory_rss:4005888
used_memory_rss_human:3.82M
used_memory_peak:822232
used_memory_peak_human:802.96K
total_system_memory:16803835904
total_system_memory_human:15.65G
used_memory_lua:37888
used_memory_lua_human:37.00K
maxmemory:0
maxmemory_human:0B
maxmemory_policy:noeviction
mem_fragmentation_ratio:4.87
mem_allocator:jemalloc-4.0.3

# Persistence
loading:0
rdb_changes_since_last_save:0
rdb_bgsave_in_progress:0
rdb_last_save_time:1497888696
rdb_last_bgsave_status:ok
rdb_last_bgsave_time_sec:-1
rdb_current_bgsave_time_sec:-1
aof_enabled:1
aof_rewrite_in_progress:0
aof_rewrite_scheduled:0
aof_last_rewrite_time_sec:-1
aof_current_rewrite_time_sec:-1
aof_last_bgrewrite_status:ok
aof_last_write_status:ok
aof_current_size:0
aof_base_size:0
aof_pending_rewrite:0
aof_buffer_length:0
aof_rewrite_buffer_length:0
aof_pending_bio_fsync:0
aof_delayed_fsync:0

# Stats
total_connections_received:1
total_commands_processed:1
instantaneous_ops_per_sec:0
total_net_input_bytes:31
total_net_output_bytes:6005118
instantaneous_input_kbps:0.00
instantaneous_output_kbps:0.00
rejected_connections:0
sync_full:0
sync_partial_ok:0
sync_partial_err:0
expired_keys:0
evicted_keys:0
keyspace_hits:0
keyspace_misses:0
pubsub_channels:0
pubsub_patterns:0
latest_fork_usec:0
migrate_cached_sockets:0

# Replication
role:master
connected_slaves:0
master_repl_offset:0
repl_backlog_active:0
repl_backlog_size:1048576
repl_backlog_first_byte_offset:0
repl_backlog_histlen:0

# CPU
used_cpu_sys:0.09
used_cpu_user:0.03
used_cpu_sys_children:0.00
used_cpu_user_children:0.00

# Cluster
cluster_enabled:0

# Keyspace
127.0.0.1:6379>
或者运行docker run -it redis:latest redis-cli也可以:
LoveHousedeiMac:~ lovehouse$ docker run -it redis:latest redis-cli -h 192.168.1.207
192.168.1.207:6379> info
# Server
redis_version:3.2.9
redis_git_sha1:00000000
redis_git_dirty:0
redis_build_id:d837dd4aae3a6933
redis_mode:standalone
os:Linux 4.9.27-moby x86_64
arch_bits:64
multiplexing_api:epoll
gcc_version:4.9.2
process_id:1
run_id:a490709296a4a15606af8650b4ae2eb922de81ff
tcp_port:6379
uptime_in_seconds:262
uptime_in_days:0
hz:10
lru_clock:4716734
executable:/data/redis-server
config_file:

# Clients
connected_clients:1
client_longest_output_list:0
client_biggest_input_buf:0
blocked_clients:0

# Memory
used_memory:822232
used_memory_human:802.96K
used_memory_rss:4005888
used_memory_rss_human:3.82M
used_memory_peak:822232
used_memory_peak_human:802.96K
total_system_memory:16803835904
total_system_memory_human:15.65G
used_memory_lua:37888
used_memory_lua_human:37.00K
maxmemory:0
maxmemory_human:0B
maxmemory_policy:noeviction
mem_fragmentation_ratio:4.87
mem_allocator:jemalloc-4.0.3

# Persistence
loading:0
rdb_changes_since_last_save:0
rdb_bgsave_in_progress:0
rdb_last_save_time:1497888696
rdb_last_bgsave_status:ok
rdb_last_bgsave_time_sec:-1
rdb_current_bgsave_time_sec:-1
aof_enabled:1
aof_rewrite_in_progress:0
aof_rewrite_scheduled:0
aof_last_rewrite_time_sec:-1
aof_current_rewrite_time_sec:-1
aof_last_bgrewrite_status:ok
aof_last_write_status:ok
aof_current_size:0
aof_base_size:0
aof_pending_rewrite:0
aof_buffer_length:0
aof_rewrite_buffer_length:0
aof_pending_bio_fsync:0
aof_delayed_fsync:0

# Stats
total_connections_received:2
total_commands_processed:5
instantaneous_ops_per_sec:0
total_net_input_bytes:122
total_net_output_bytes:11980083
instantaneous_input_kbps:0.00
instantaneous_output_kbps:0.00
rejected_connections:0
sync_full:0
sync_partial_ok:0
sync_partial_err:0
expired_keys:0
evicted_keys:0
keyspace_hits:0
keyspace_misses:0
pubsub_channels:0
pubsub_patterns:0
latest_fork_usec:0
migrate_cached_sockets:0

# Replication
role:master
connected_slaves:0
master_repl_offset:0
repl_backlog_active:0
repl_backlog_size:1048576
repl_backlog_first_byte_offset:0
repl_backlog_histlen:0

# CPU
used_cpu_sys:0.16
used_cpu_user:0.05
used_cpu_sys_children:0.00
used_cpu_user_children:0.00

# Cluster
cluster_enabled:0

# Keyspace
192.168.1.207:6379>
2.备份,迁移和克隆docker镜像:
2.1 检查原有信息:
LoveHousedeiMac:~ lovehouse$ docker ps -a
CONTAINER ID        IMAGE                         COMMAND                  CREATED             STATUS                     PORTS               NAMES
f98eeeebda7e        redis:latest                  "docker-entrypoint..."   2 weeks ago         Exited (137) 2 weeks ago                       quizzical_torvalds
1a6e061b7233        redis:latest                  "docker-entrypoint..."   2 weeks ago         Exited (0) 2 weeks ago                         hungry_spence
1fa497550b7e        redis:latest                  "docker-entrypoint..."   2 weeks ago         Exited (0) 3 days ago                          pensive_sinoussi
c9f09116cc83        oracle/database:12.2.0.1-ee   "/bin/sh -c 'exec ..."   6 weeks ago         Exited (137) 10 days ago                       oracle
LoveHousedeiMac:~ lovehouse$
2.1 停下container,并将container commit成images:
LoveHousedeiMac:~ lovehouse$ docker stop pensive_sinoussi
pensive_sinoussi
LoveHousedeiMac:~ lovehouse$
LoveHousedeiMac:~ lovehouse$
LoveHousedeiMac:~ lovehouse$ docker commit -p 1fa497550b7e container-backup
sha256:b5dfe58c6528f02c7652f3261e1e60ea45c52aadf3f004d0dbd01acb0236f884
LoveHousedeiMac:~ lovehouse$
LoveHousedeiMac:~ lovehouse$
2.3 检查一下images是否已经建立
LoveHousedeiMac:~ lovehouse$ docker images
REPOSITORY          TAG                 IMAGE ID            CREATED             SIZE
container-backup    latest              b5dfe58c6528        9 seconds ago       98.9MB
redis               latest              83744227b191        3 weeks ago         98.9MB
oracle/database     12.2.0.1-ee         4f9df5f46a19        6 weeks ago         14.8GB
oraclelinux         7-slim              442ebf722584        2 months ago        114MB
LoveHousedeiMac:~ lovehouse$
2.4 将container-backup 这个image做成tar文件:
LoveHousedeiMac:idocker lovehouse$ docker save -o ./container-backup.tar container-backup
LoveHousedeiMac:idocker lovehouse$
LoveHousedeiMac:idocker lovehouse$ ls -l
total 200792
-rw-------   1 lovehouse  staff  102801920  7  5 00:34 container-backup.tar
drwxr-xr-x@ 19 lovehouse  staff        646  5 20 20:04 docker-images-master
drwxr-xr-x@  7 lovehouse  staff        238  6  2  2016 docker-redis-cluster-master
LoveHousedeiMac:idocker lovehouse$
2.5 我们这里将备份的东西,load进去,并且成为redis_2
LoveHousedeiMac:~ lovehouse$ cp -pR redisdata redisdata_2
LoveHousedeiMac:~ lovehouse$ cd idocker
LoveHousedeiMac:idocker lovehouse$ ls
container-backup.tar		docker-images-master		docker-redis-cluster-master
LoveHousedeiMac:idocker lovehouse$
LoveHousedeiMac:idocker lovehouse$
LoveHousedeiMac:idocker lovehouse$ docker images
REPOSITORY          TAG                 IMAGE ID            CREATED             SIZE
container-backup    latest              b5dfe58c6528        8 minutes ago       98.9MB
redis               latest              83744227b191        3 weeks ago         98.9MB
oracle/database     12.2.0.1-ee         4f9df5f46a19        6 weeks ago         14.8GB
oraclelinux         7-slim              442ebf722584        2 months ago        114MB
LoveHousedeiMac:idocker lovehouse$
LoveHousedeiMac:idocker lovehouse$
2.6 docker run创建第二个redis,注意这里第二个redis的端口映射为26379,不修改的话,会和第一个redis的端口冲突。
LoveHousedeiMac:idocker lovehouse$ docker run --name redis_2 -p 26379:6379 -v /Users/lovehouse/redis_2:/data container-backup:latest
                _._
           _.-``__ ''-._
      _.-``    `.  `_.  ''-._           Redis 3.2.9 (00000000/0) 64 bit
  .-`` .-```.  ```\/    _.,_ ''-._
 (    '      ,       .-`  | `,    )     Running in standalone mode
 |`-._`-...-` __...-.``-._|'` _.-'|     Port: 6379
 |    `-._   `._    /     _.-'    |     PID: 1
  `-._    `-._  `-./  _.-'    _.-'
 |`-._`-._    `-.__.-'    _.-'_.-'|
 |    `-._`-._        _.-'_.-'    |           http://redis.io
  `-._    `-._`-.__.-'_.-'    _.-'
 |`-._`-._    `-.__.-'    _.-'_.-'|
 |    `-._`-._        _.-'_.-'    |
  `-._    `-._`-.__.-'_.-'    _.-'
      `-._    `-.__.-'    _.-'
          `-._        _.-'
              `-.__.-'

1:M 04 Jul 16:43:54.942 # WARNING: The TCP backlog setting of 511 cannot be enforced because /proc/sys/net/core/somaxconn is set to the lower value of 128.
1:M 04 Jul 16:43:54.942 # Server started, Redis version 3.2.9
1:M 04 Jul 16:43:54.942 # WARNING you have Transparent Huge Pages (THP) support enabled in your kernel. This will create latency and memory usage issues with Redis. To fix this issue run the command 'echo never > /sys/kernel/mm/transparent_hugepage/enabled' as root, and add it to your /etc/rc.local in order to retain the setting after a reboot. Redis must be restarted after THP is disabled.
1:M 04 Jul 16:43:54.943 * The server is now ready to accept connections on port 6379
2.7 启动第二个redis
LoveHousedeiMac:idocker lovehouse$ docker start redis_2
redis_2
LoveHousedeiMac:idocker lovehouse$
2.8 检查2个redis已经部署好了。
LoveHousedeiMac:idocker lovehouse$ docker ps
CONTAINER ID        IMAGE                     COMMAND                  CREATED              STATUS              PORTS                     NAMES
240382527b36        container-backup:latest   "docker-entrypoint..."   About a minute ago   Up 17 seconds       0.0.0.0:26379->6379/tcp   redis_2
1fa497550b7e        redis:latest              "docker-entrypoint..."   2 weeks ago          Up 3 minutes        0.0.0.0:6379->6379/tcp    pensive_sinoussi
LoveHousedeiMac:idocker lovehouse$
LoveHousedeiMac:idocker lovehouse$ docker run -it redis:latest redis-cli -h 192.168.1.207 -p 26379 info server
# Server
redis_version:3.2.9
redis_git_sha1:00000000
redis_git_dirty:0
redis_build_id:d837dd4aae3a6933
redis_mode:standalone
os:Linux 4.9.31-moby x86_64
arch_bits:64
multiplexing_api:epoll
gcc_version:4.9.2
process_id:1
run_id:a326152e6689deb5bcf507354e92c53e13bbeaeb
tcp_port:6379
uptime_in_seconds:300
uptime_in_days:0
hz:10
lru_clock:6014761
executable:/data/redis-server
config_file:
LoveHousedeiMac:idocker lovehouse$
LoveHousedeiMac:idocker lovehouse$ docker run -it redis:latest redis-cli -h 192.168.1.207 -p 6379 info server
# Server
redis_version:3.2.9
redis_git_sha1:00000000
redis_git_dirty:0
redis_build_id:d837dd4aae3a6933
redis_mode:standalone
os:Linux 4.9.31-moby x86_64
arch_bits:64
multiplexing_api:epoll
gcc_version:4.9.2
process_id:1
run_id:dd00a257e902c91c5316ae3aafb1d67f6e30270b
tcp_port:6379
uptime_in_seconds:478
uptime_in_days:0
hz:10
lru_clock:6014771
executable:/data/redis-server
config_file:
LoveHousedeiMac:idocker lovehouse$
六、Redis 4.0的新特性
1. Module的支持。
module可以在不改变redis源代码主分支的基础上,通过高层抽象的API挂载外部模块,来提供更多的功能,我的理解,这是类似postgresSQL的hook。
2. PSYNC v2
PSYNC(Partial Replication,增量同步)得到改进。
之前是从库尝试发送 psync 命令到主库,主库判断是否满足 psync 条件, 满足就返回 +CONTINUE 进行增量同步, 否则返回 +FULLRESYNC runid offfset。
虽然psync 可以解决短时间主从同步断掉重连问题,但以下几个场景仍然是需要全量同步:
a). 主库/从库有重启过。因为 runnid 重启后就会丢失,所以当前机制无法做增量同步。
b). 从库提升为主库。其他从库切到新主库全部要全量不同数据,因为新主库的 runnid 跟老的主库是不一样的
psync v2增加了一个replid2,来记录是从哪个master做同步的,这个replid2是从master的replid继承过来的。如果之前这两个曾经属于同一个主库(多级也允许), 那么新主库的 replid2 就是之前主库的 replid。只要之前是同一主库且新主库的同步进度比这个从库还快就允许增量同步。
因此上述的第二点,从库提升为主库之后,还是可以使用增量同步。
3. 缓存回收策略改进。
增加了LFU(Last Frequently Used)缓存回收策略。最不常用的缓存数据进行清理。
4. 非阻塞性DEL和FLUSHALL/FLUSHDB
在 Redis 4.0 之前, 用户在使用 DEL 命令删除体积较大的键, 又或者在使用 FLUSHDB 和 FLUSHALL 删除包含大量键的数据库时, 都可能会造成服务器阻塞。
redis 4.0提供了unlink命令来替代del命令。这个命令可以异步的删除大量key且不会阻塞。(注,为了保留向前的兼容性,del命令仍然保留)
同时,redis 4.0还提供了flushdb async和flushall async,两个命令的async选项,来提供异步的删除大量key。
redis 4.0还提供了一个交换db的命令swapdb,如swapdb 0 1,就可以将db0和db1交换。原来在db0中的key,全部去了db1。
5.支持mixed RDB-AOF的持久化模式。
Redis 就可以同时兼有 RDB 持久化和 AOF 持久化的优点 —— 既能够快速地生成重写文件,也能够在出现问题时,快速地载入数据。
开启混合存储模式后 aof 文件加载的流程如下:
a). aof 文件开头是 rdb 的格式, 先加载 rdb 内容再加载剩余的 aof
b). aof 文件开头不是 rdb 的格式,直接以 aof 格式加载整个文件
判断 aof 文件的前面部分是否为 rdb 格式,只需要判断前 5 个字符是否是 REDIS。这个是因为rdb持久化开头就是REDIS, 同时aof文件开头一定不会是 REDIS(以前的版本文件开头都是*)。
6. 增加了内存检查命令,memory。如memory stats,memory usage,memory purge
7.增加了对NAT的支持。(主要是为了解决redis cluster在docker上的问题)。
更多信息,可见: Redis 4.0 release notes和The first release candidate of Redis 4.0 is out